From Data Chaos to Clarity
AI-powered tools for faster, clearer decisions
THE PROJECT
Overview
Conduct caregiver and staff interviews
Observe clients across home, school, and clinic settings
Collect and analyze varied data sources (notes, reports, videos)
Identify behavior functions and draft documentation
My Role
Design Lead
Led the design efforts across product research, user interviews, user flows, rapid prototyping, and usability testing
Team
Engineering Lead
Billy Franklin
Researchers
Haley Scheer; Jessica Peng; Laura Heppell
Timeline
Feb 2025 - Jul 2025
Results & Impact
Reduction in behavior plan prep time (cut from 1.5 hours to 45 minutes) through automated data labeling and graph generation
AI label accuracy sustained with human-in-the-loop reviews
Boost in analyst satisfaction after cutting manual data entry and unifying tools into a single workflow

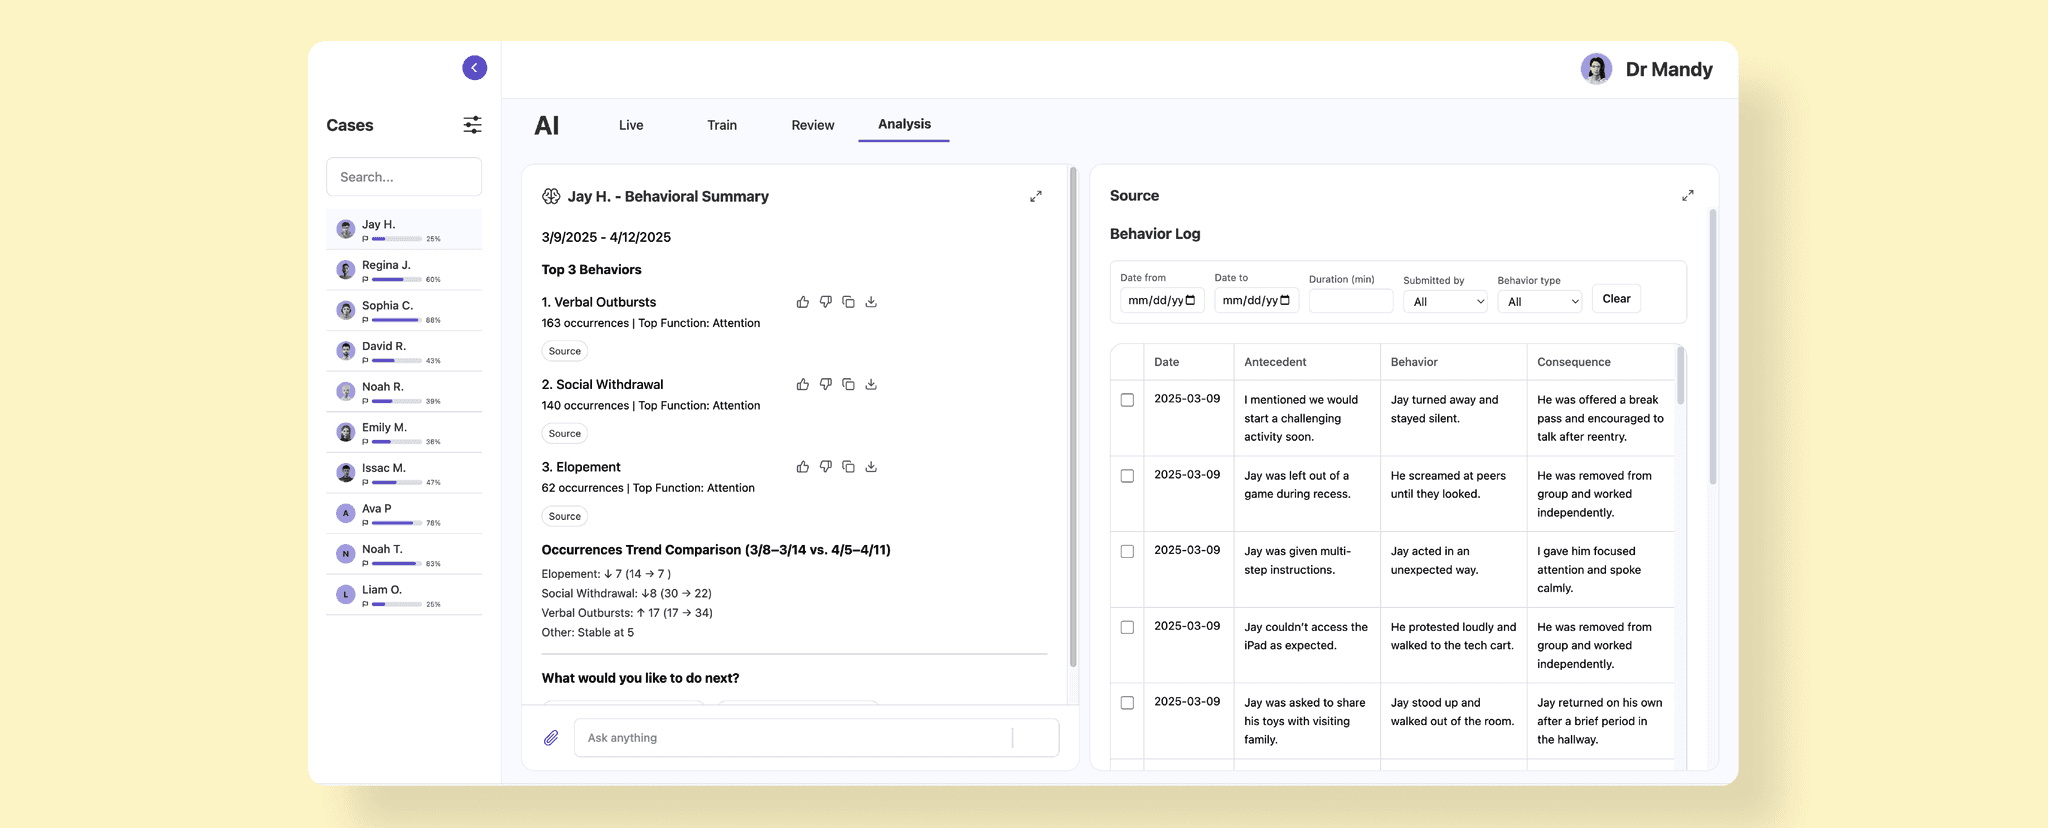
Auto Behavior Summary


REQUIRNMENTS
Project Scope
The backend AI already labels behavior logs with over 90% accuracy, but BCBAs still need an efficient way to analyze those labels.
RESEARCH
Discovering Pain Points
When I joined the project, I conducted follow-up interviews with two curaJOY’s BCBA consultants and learned that:


User Persona
To stay focused on the core needs of BCBAs and help stakeholders quickly understand the main user group’s pain points, I developed this persona:

Dr. Mandy
BCBA-D
Prioritizes accuracy, efficiency, and clear insights in her workflow
Behavior
Oversees assessments and treatment plans for multiple clients
Reviews behavior data (ABC logs) collected by teachers and caregivers
Creates visual reports for FBAs and BIPs
Pain Points
Core Needs
Insights From Existing Tools
To gather inspiration, I reviewed tools aligned with the project’s focus areas:


AI Tools
Strengths
Can quickly summarize large datasets
Flexible natural language interaction
Integration-ready via APIs
Gaps
Limited domain-specific accuracy without custom training
No built-in FBA/BIP behavioral health frameworks
Lack of persistent memory across sessions for ongoing cases
Graphing Tools
Strengths
Advanced filtering, drill-down, and visualization options
Supports multiple data source integrations
Strong export and sharing capabilities
Customizable dashboards for different audiences
Gaps
Steep learning curve for non-data specialists
Requires manual data preparation and cleaning
No built-in contextual or narrative explanations for graphs
How might we use AI to turn messy behavior logs into clear, actionable insights—fast?
DESIGN
Smart Tools for Complex Cases


Design Evolutions
AI Analysis


Dynamic Graph

USABILITY TESTING
Testing Method

Method
Moderated 30 minutes user usability testing

Participants
10 BCBAs who regularly conduct FBA and BIP


Test Results
What Worked
Needs Improvement
User Quotes
"Can you filter by that? Like, the filter by submitter? That's a big thing I liked to do when I look through data…"
"The occurrences are compared to what period of time?…I think I need to see more context"
"We most definitely use line graphs, bar graphs and it is important to see duration as well…"
"…So this attaches the sources to the chat, I think it's great to give it that context"
"I like what I am looking at, very impressed!"
DESIGN ITERATION
User-Informed Redesign
Based on user feedback, I refined key features to better meet their needs. After two rounds of critiques, here are some before-and-after redesigns.


